Everything Telemetry gives you
- 01
Traces, logs and metrics
OTLP over HTTP (protobuf or JSON) and gRPC. GELF and StatsD land in the same logs and metrics.
- 02
Spans meet provider calls
Stuntman reads the trace ID on the way in, so a span to Azure Blob opens the call and the rule that answered it.
- 03
Wait instead of sleeping
wait_for_trace and wait_for_log return the first match after the agent acts in the app.
- 04
Where the time went
find_slow_spans lists spans over a threshold, provider spans first.
- 05
Logs of one trace
logs_of_trace gives every line the app wrote while serving a request; lines_around shows the context across services.
- 06
Did the fix work?
count_logs and compare_windows say whether an error stopped or a metric moved after a change.
- 07
Why a metric jumped
why_it_jumped finds the steps over twice the median and the breakdown value and Stuntman answer behind them.
- 08
Calls that escaped
real_provider_calls lists hosts the app still calls directly, from its own spans.
- 09
Forward to a real APM
Copy everything to a real backend; the API key is a Secrets reference, never a value.
The screens
Each number is a control or a reading on the real screen. Everything you can click there, your agent can do with a tool.
A trace joined to the provider calls
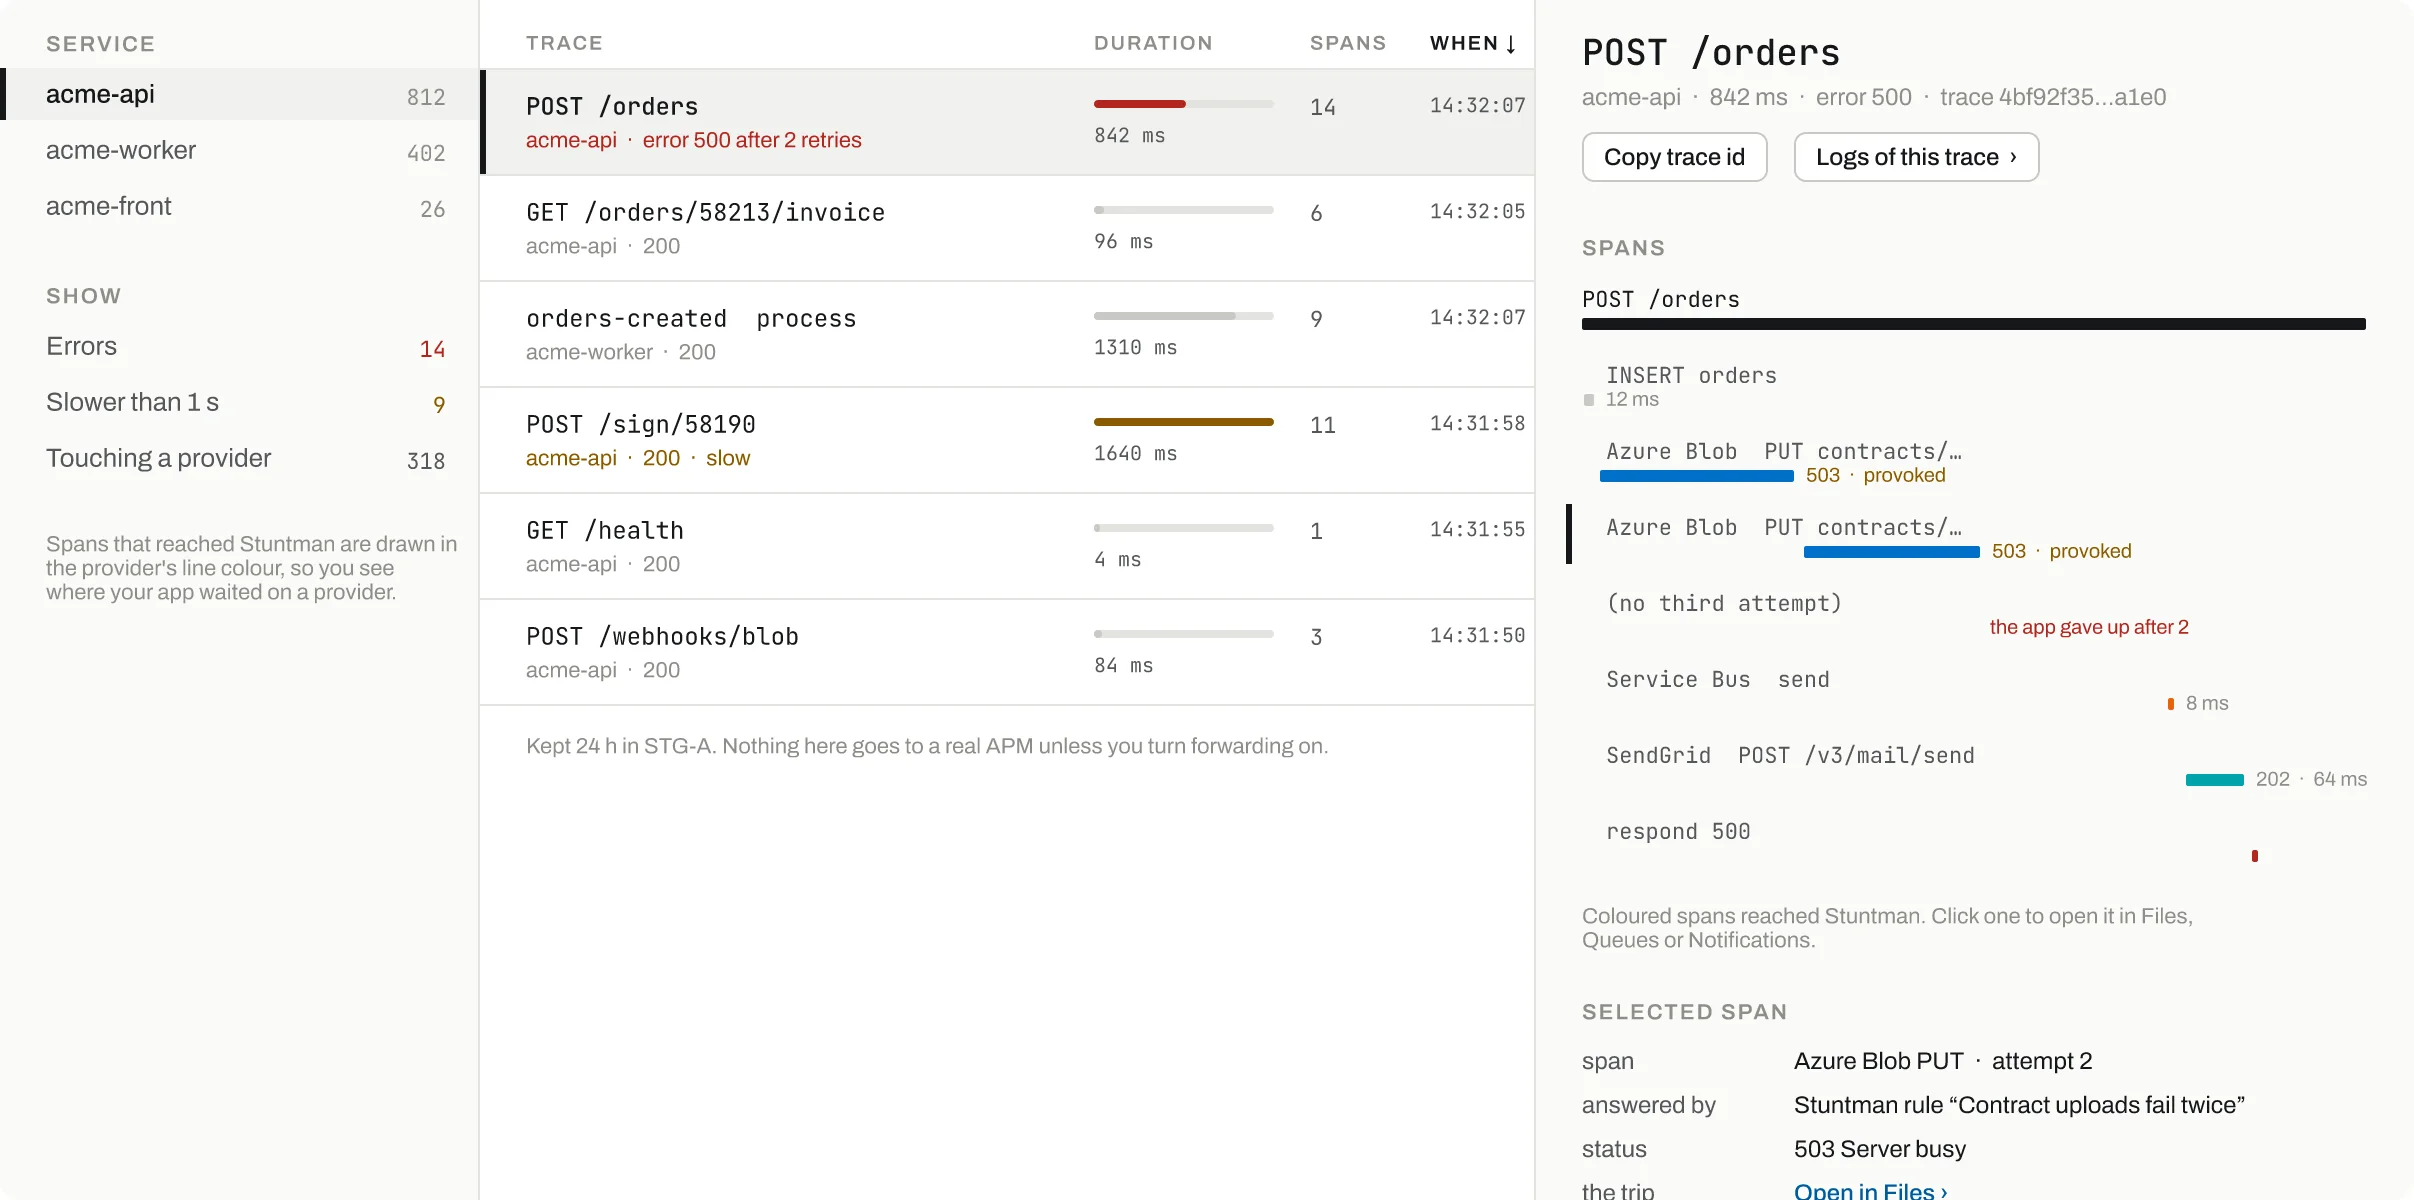
Traces with spans that reached Stuntman, drawn in the provider's colour.
POST /orders: error 500 after 2 retries.
Two Azure Blob PUTs answered 503 by a Stuntman rule.
No third attempt: the retry policy is visible in the span tree.
The rule that answered the span, and a link to the object in Files.
- Touching a provider
Traces with spans that reached Stuntman, drawn in the provider's colour.
- Failed request
POST /orders: error 500 after 2 retries.
- Provoked spans
Two Azure Blob PUTs answered 503 by a Stuntman rule.
- The app gave up
No third attempt: the retry policy is visible in the span tree.
- Answered by
The rule that answered the span, and a link to the object in Files.
Logs with their trace
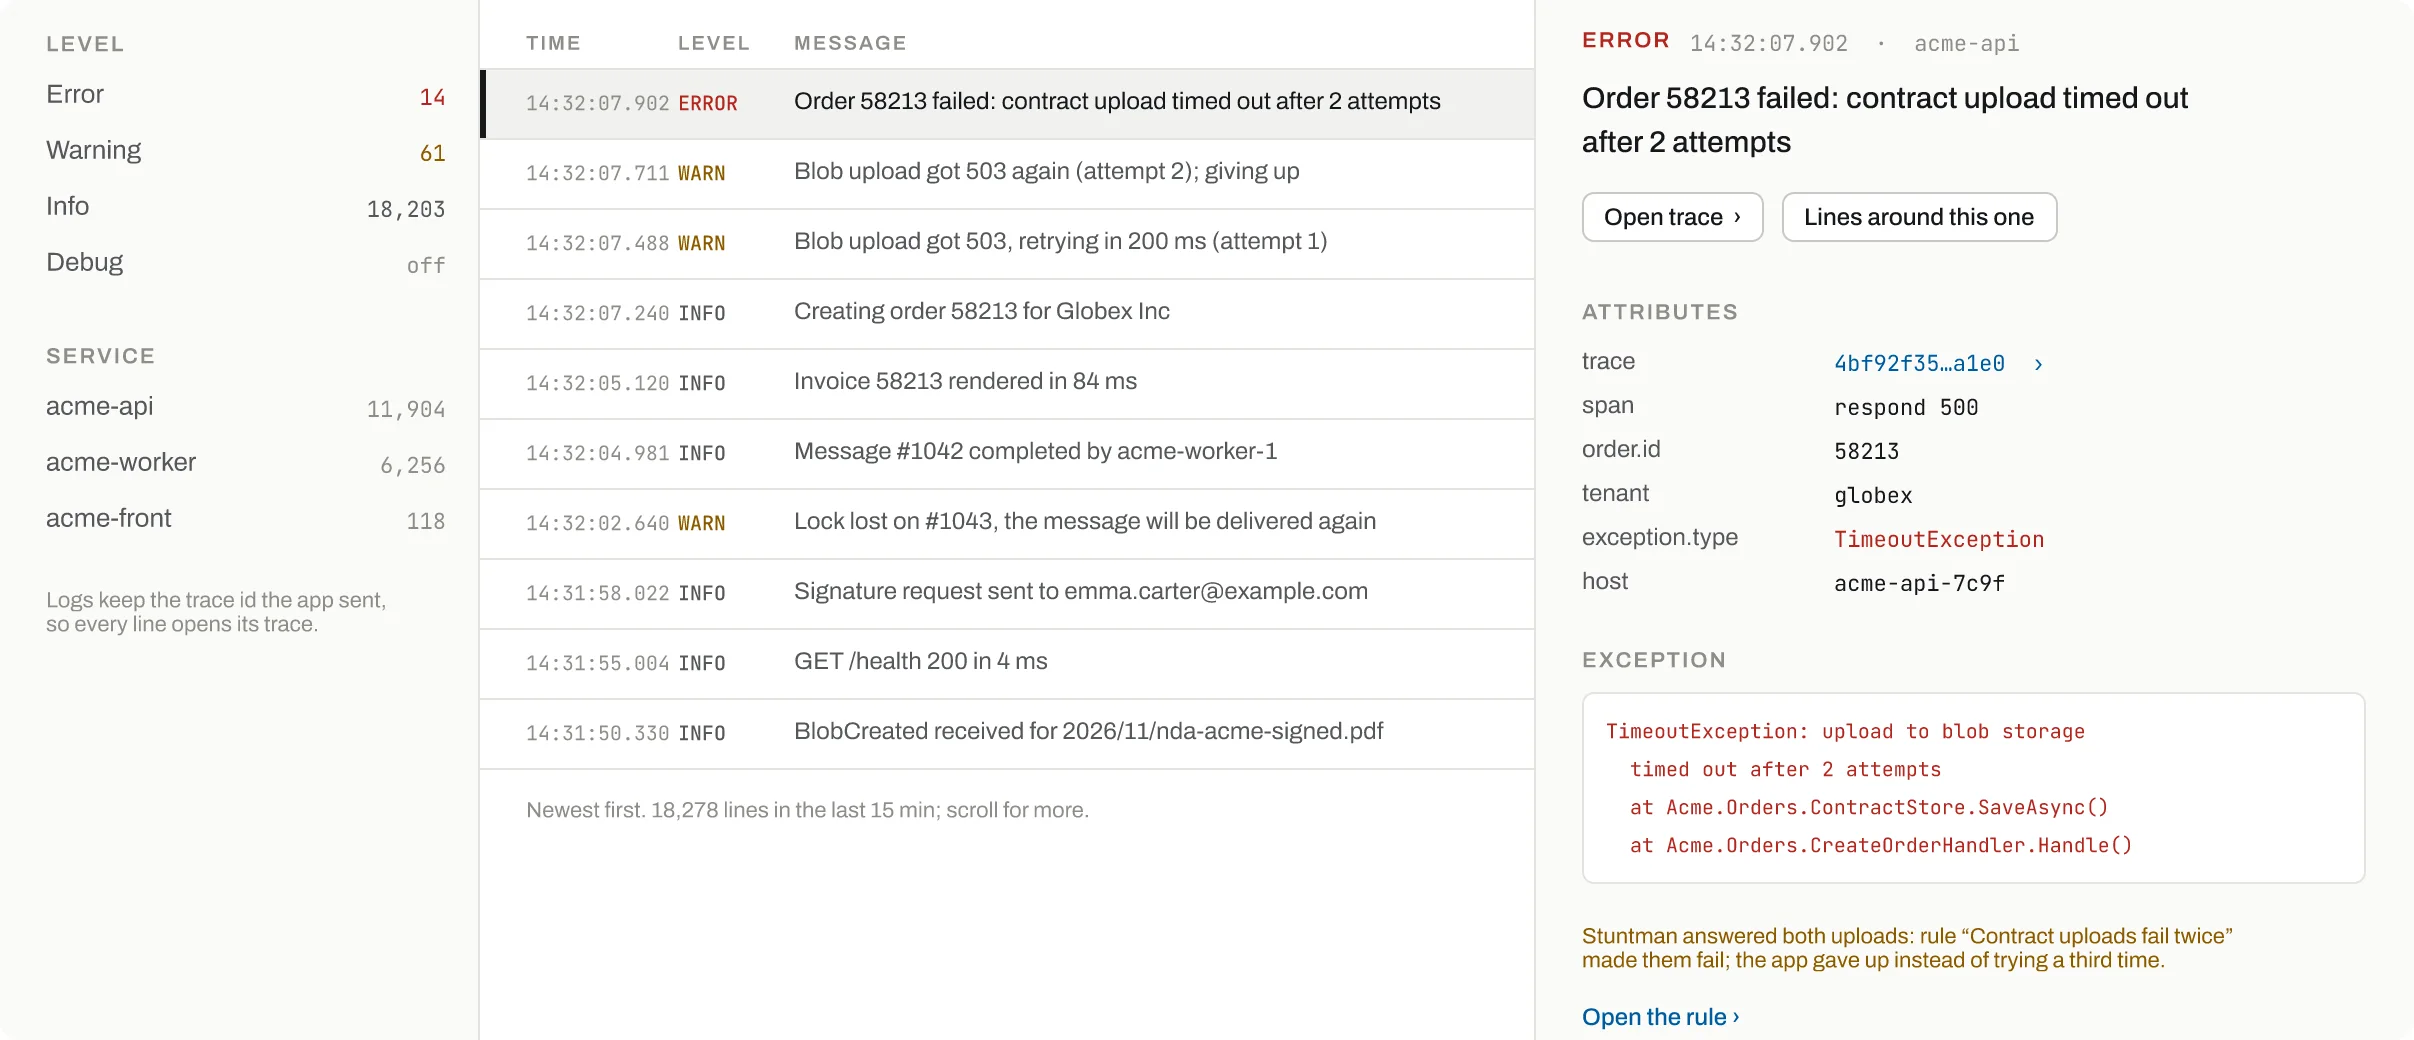
Counts per level and service; filter with list_logs or count_logs.
The line the app wrote when the order failed.
Warnings for each 503 the app got, with the attempt number.
Every line keeps the trace id the app sent, so it opens its trace.
Which rule made the uploads fail and why the app gave up.
- Level and service
Counts per level and service; filter with list_logs or count_logs.
- The error
The line the app wrote when the order failed.
- Retries
Warnings for each 503 the app got, with the attempt number.
- Trace id
Every line keeps the trace id the app sent, so it opens its trace.
- Stuntman's side
Which rule made the uploads fail and why the app gave up.
Metrics and why they jumped
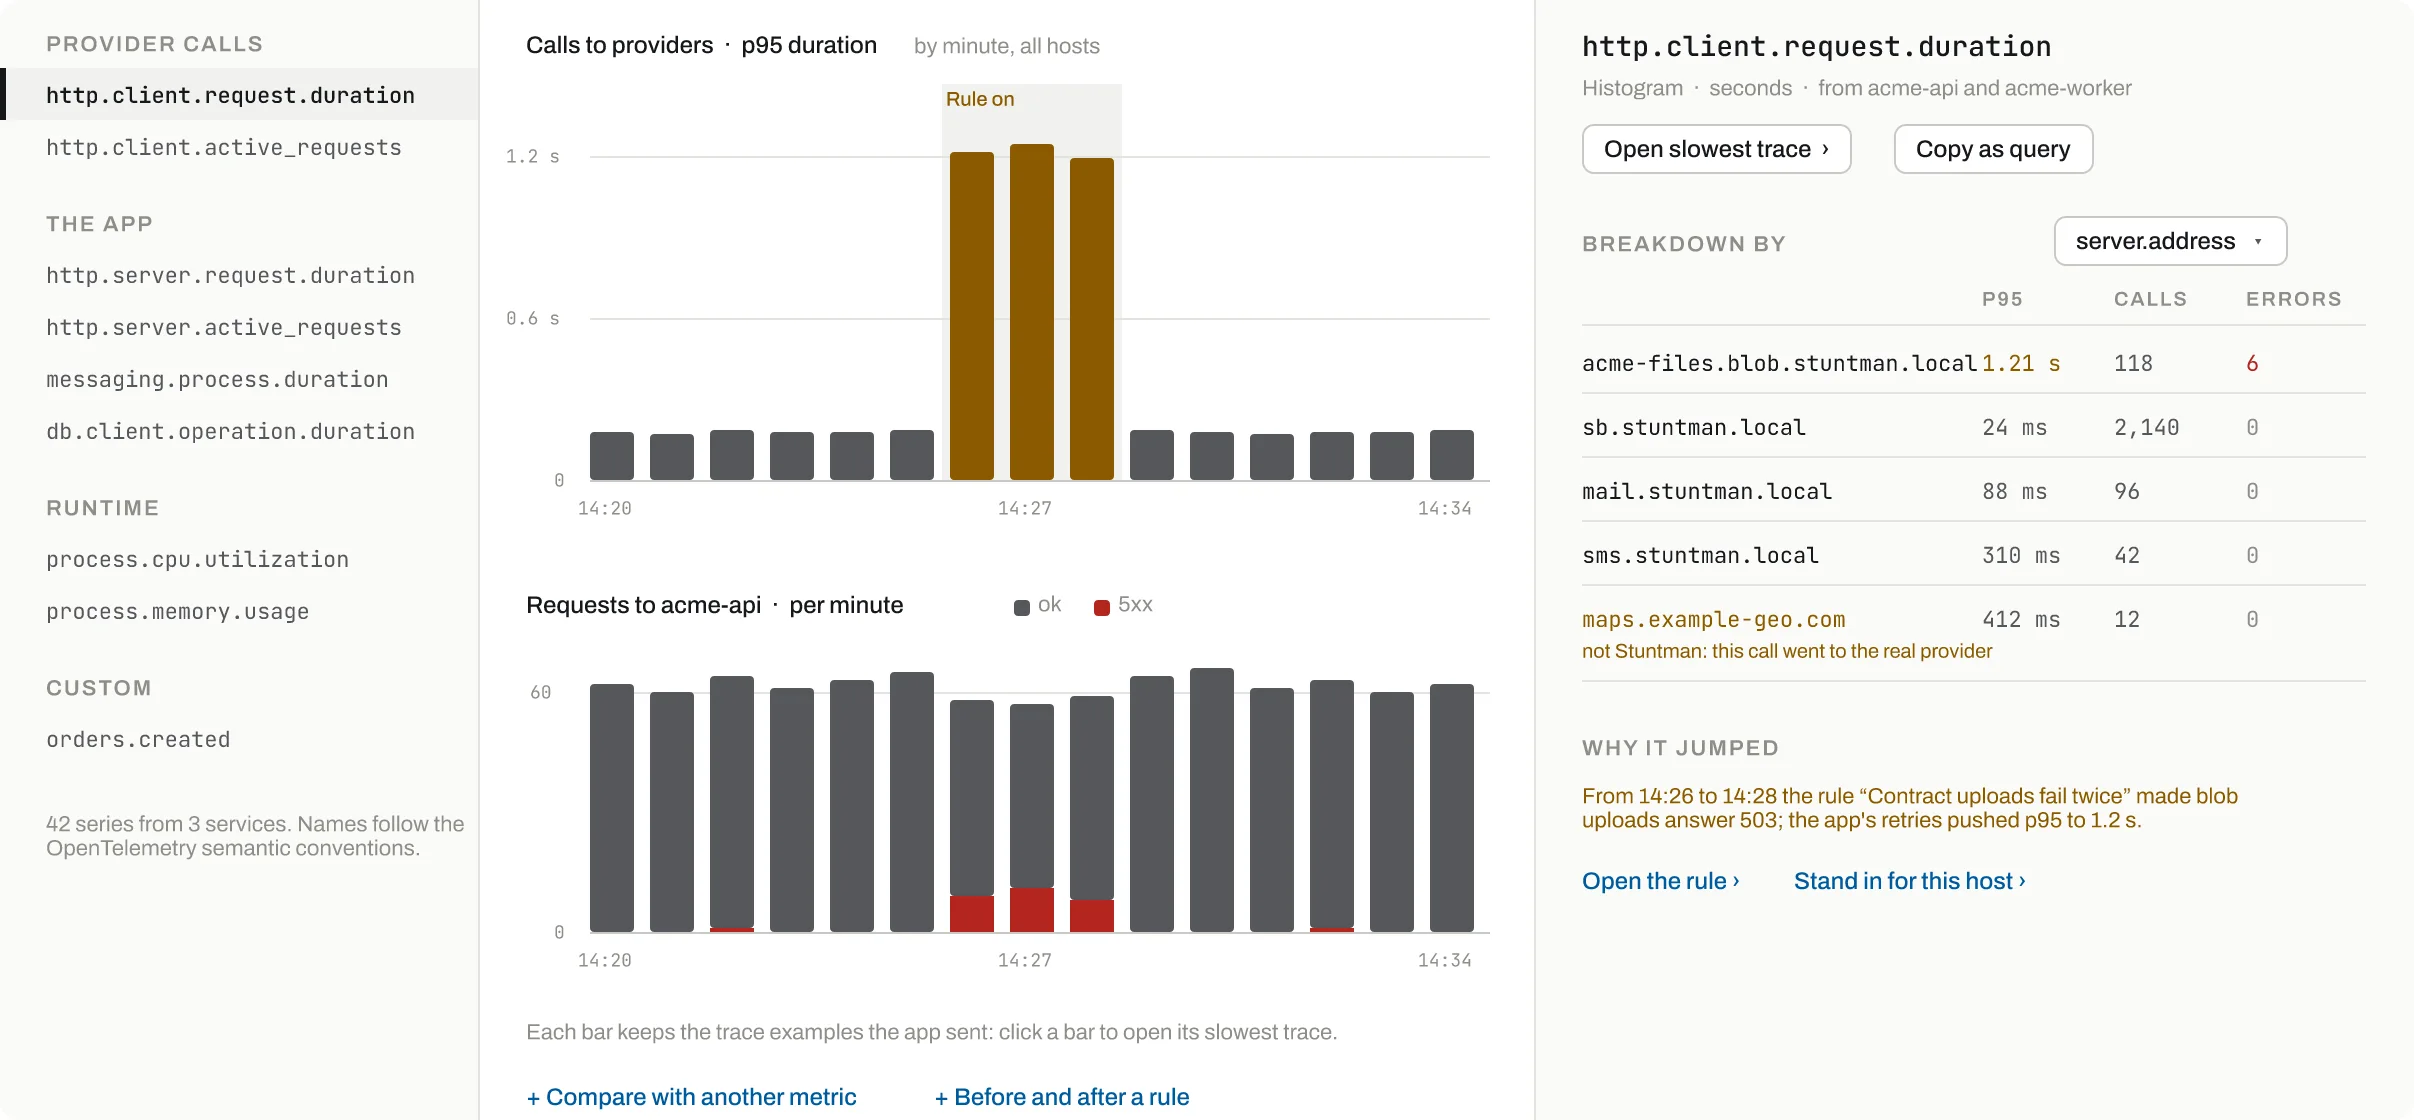
Metrics grouped by provider calls, the app, runtime and custom.
p95 jumps while a Stuntman rule was failing uploads.
Errors the app answered while the rule was on.
A host the app still calls directly: a forgotten base URL.
The step, the breakdown value that drove it and what Stuntman answered.
- Semantic names
Metrics grouped by provider calls, the app, runtime and custom.
- Rule on
p95 jumps while a Stuntman rule was failing uploads.
- 5xx
Errors the app answered while the rule was on.
- Not Stuntman
A host the app still calls directly: a forgotten base URL.
- Why it jumped
The step, the breakdown value that drove it and what Stuntman answered.
Break it on purpose
The failures you need to test, exactly when you ask: from the screen or by a tool call, each one shown on the timeline with who caused it.
UnauthorizedThe collector answers 401 or 403
provoke_collector 401 | 403ThrottledThe collector answers 429
provoke_collector 429UnavailableThe collector answers 503
provoke_collector 503RefusedConnections to the collector are refused
provoke_collector refusedSlow collectorExports take longer: does the app block?
provoke_collector slowHalf droppedHalf of the batches are dropped
provoke_collector drop_halfSignal offTraces, logs or metrics answered 200 and dropped
set_signal on false
Why not the real sandbox
No APM bill
Traces, logs and metrics stay local per environment; nothing goes to a paid backend unless you turn forwarding on.
Cause and effect together
A span shows the provider call and the rule that failed it, which no real APM can see.
Built for agents
wait_for_trace, why_it_jumped and count_logs answer a question in one call instead of a dashboard.
Leaks become visible
Calls that bypass Stuntman show up from the app's own spans, so a test cannot quietly hit a real provider.
Your AI agent drives it
Claude Code, Codex or any MCP client connects to /mcp (or calls /api over plain HTTP), sets the stand-in up, breaks it on cue and reads what your app did.
After the order fails, find out why and whether the app really retried the upload.
MCP tools
telemetry_overviewServices, counts, refused batches, endpointslist_tracesTraces by service, status, slowness or providerget_traceThe span tree with provider tripswait_for_traceWait for the first matching tracefind_slow_spansSpans over a threshold, provider spans firstlogs_of_traceEvery line of one tracecount_logsCheck an error stopped after a fixwhy_it_jumpedFind what drove a metric jumpprovoke_collectorMake the collector failreal_provider_callsHosts the app called directly
The same over HTTP
- GET
/api/telemetry/traces/wait - GET
/api/telemetry/traces/{trace_id} - GET
/api/telemetry/traces/{trace_id}/logs - GET
/api/telemetry/metrics/{name}/why - POST
/api/telemetry/collector/provoke - GET
/api/apis/real-provider-calls
- UDP has no host name: GELF and StatsD go to the default environment, or the one a _stuntman_env field or stuntman_env tag names.